Absolute zero temperature and the Kelvin scale
As any material is cooled the molecules move more and more slowly. If that continues there must be, in theory at least, a point at which the molecules stop altogether.

If they stop then they have no more energy to lose and they are at the lowest possible temperature – absolute zero.
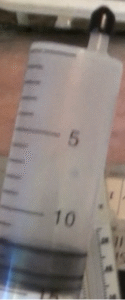
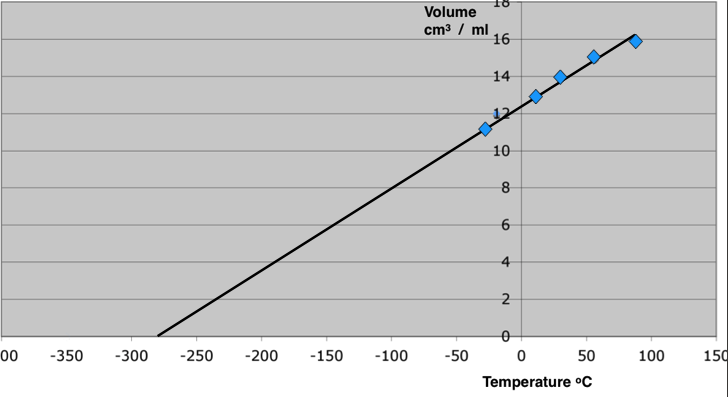
If in and experiment, we trap gas in a syringe and then cool that gas down, because the molecules move slower and slower as the gas cools the volume decreases. A plot of the temperature against volume of the air trapped in the syringe is (close to) a straight line. If we assume that the volume of the molecules of a gas is insignificant, compared to the volume they occupy due to their motion (something that is quite close to being true for light gases). If we then extend the scale of the graph and “extrapolate” the graph line until it cuts the temperature axis then that is the theoretical temperature at which there is zero volume. At this point the molecules must have stopped. This is our estimate of absolute zero temperature.
The Kelvin scale of temperature

The Kelvin temperature scale is based upon a carefully determined and agreed value of absolute zero. This is about -273.15 degrees on the Celcius scale (rounded to -273 in all my examples).
The Kelvin scale uses the same sized divisions of temperature but zero is at “absolute zero” and so the melting point of ice is 273 K and the boiling point of water is 373 K.
All calculations using gas equations use the Kelvin scale of temperature, so that is the Celcius temperature plus 273.